#
Dr. M. Baron, Statistical Machine Learning class, STAT-427/627
# GEOMETRY of LDA and QDA
There is a nice Field
Goal data among the data sets on our course web site. We’ll read this text file
directly from the site.
> FG = read.table(url("http://fs2.american.edu/~baron/627/R/Field%20goals.txt"))
> attach(FG)
The following objects are masked from FG (pos = 5):
V1, V2, V3
> distance = V1; made = V2; week = V3;
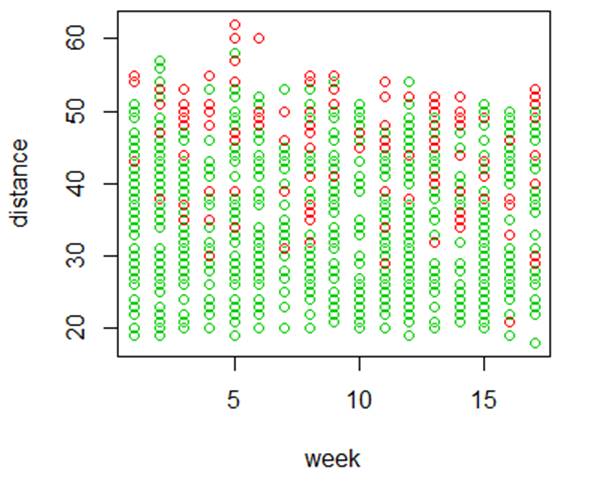
> plot(
week, distance, col = made+2 ) # Adding 2, the colors become green and red
for made and missed field
goals.
# Apply LDA and QDA to predict success of a
field goal attempt
> GF.lda = lda( made ~ distance + week, CV=TRUE )
> mean( GF.lda$class == made )
[1] 0.8090717 # Classification rate of 80.9%
> plot( week, distance, col = as.numeric(GF.lda$class)+1 )
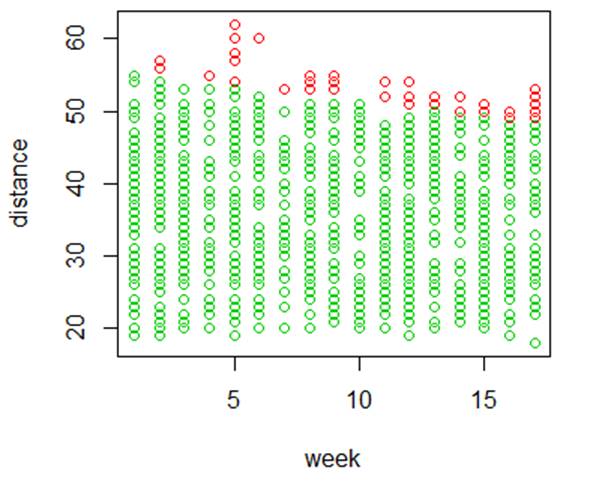
# We see a linear decision boundary for
LDA.
> GF.qda = qda ( made ~ distance + week, CV=TRUE )
> plot( week, distance, col = as.numeric(GF.qda$class)+1 )
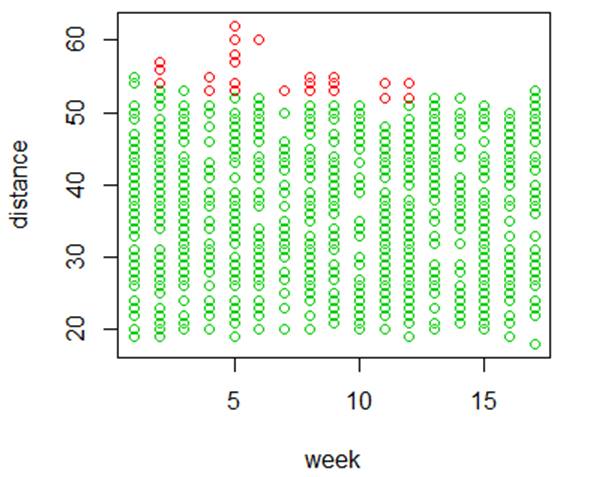
# A curvy boundary.